Cloudify Spring Boot Application (Part II)
This blog post is a series of three posts.
- In the first of the posts I described how to Dockerize a Spring Boot application and run it in Kubernetes.
- The second part of the tutorial looks on how to monitor the application and see if everything is ok.
- And in the last part of the series I’ll look on how to analyze and collect logs of the Spring Boot application.
Modify the application to export metrics
In February 2018 was anounced as a facade for application metrics in Spring Applications. It is very easy to use and easy to integrate with monitoring solutions like Prometheus and other monitoring vendors.
It’s very easy to modify our application developed in the first blog post to export Prometheus metrics.
Therefore we first add a new dependency to Maven the micrometer Prometheus registry:
<dependency>
    <groupId>io.micrometer</groupId>
    <artifactId>micrometer-registry-prometheus</artifactId>
    <version>1.0.4</version>
</dependency>
And in the next step we define that the prometheus metrics should be available as endpoint in actuator:
management.endpoints.web.exposure.include=prometheus,health
management.server.port=8081
The interresting part here is, that we first define that the prometheus and the health metrics should be included and then that they should be exposed on a different port. This is intended to prevent access to the metrics for normal users, the metrics should be accessible only to allowed users.
It’s important to also enable health, this is by default enabled, but if we overwrite this we have to define it also otherwise our Kubernetes deployment will run into Crash Loops. In the previous post we’ve defined that Kubernetes should do liveness and readiness probes on the health endpoint.
Now we should see, when we start our applications, that there is a new mapped endpoint /actuator/prometheus on port 8081 when we access these resource we should see some metrics exposed by the application:
$ http localhost:8081/actuator/prometheus
HTTP/1.1 200
Content-Length: 9892
Content-Type: text/plain; version=0.0.4;charset=utf-8
Date: Sun, 27 May 2018 21:00:35 GMT

# HELP jvm_gc_memory_promoted_bytes_total Count of positive increases in the size of the old generation memory pool before GC to after GC
# TYPE jvm_gc_memory_promoted_bytes_total counter
jvm_gc_memory_promoted_bytes_total 1.5868656E7
# HELP jvm_gc_pause_seconds Time spent in GC pause
# TYPE jvm_gc_pause_seconds summary
jvm_gc_pause_seconds_count{action="end of minor GC",cause="Allocation Failure",} 1.0
jvm_gc_pause_seconds_sum{action="end of minor GC",cause="Allocation Failure",} 0.032
jvm_gc_pause_seconds_count{action="end of minor GC",cause="Metadata GC Threshold",} 1.0
jvm_gc_pause_seconds_sum{action="end of minor GC",cause="Metadata GC Threshold",} 0.018
jvm_gc_pause_seconds_count{action="end of major GC",cause="Metadata GC Threshold",} 1.0
jvm_gc_pause_seconds_sum{action="end of major GC",cause="Metadata GC Threshold",} 0.107
...
You can also simply define your own metrics and append them to the exported metrics. Here you can see how to update the example application to export a custom metric:
package de.koudingspawn.demo;

import io.micrometer.core.instrument.Counter;
import io.micrometer.core.instrument.MeterRegistry;
import org.springframework.stereotype.Component;

@Component
class HelloService {

    private final Counter counter;

    HelloService(MeterRegistry registry) {
        this.counter = Counter.builder("hello_counter")
                .description("Count visits")
                .register(registry);
    }

    void increment() {
        counter.increment();
    }

}
@RestController
@RequestMapping("/hello")
public class HelloController {

    private final HelloService helloService;

    public HelloController(HelloService helloService) {
        this.helloService = helloService;
    }

    @GetMapping("/{name}")
    public String helloWorld(@PathVariable("name") String name) {
        helloService.increment();
        return String.format("Hello %s", name);
    }
}
In the metrics available via the /actuator/prometheus endpoint you should see it also:
# HELP hello_counter_total Count visits
# TYPE hello_counter_total counter
hello_counter_total 4.0
Configure Prometheus to scrape metrics from pods
In one of my posts I described how to deploy Prometheus in a Kubernetes cluster.
Now I’ll describe the steps to configure Prometheus deployed in the Cluster to scrape Pods for metrics. Therefore we add to the scrape_configs a new job named kubernetes-pods:
- job_name: 'kubernetes-pods'

  tls_config:
    insecure_skip_verify: true


  kubernetes_sd_configs:
  - role: pod

  relabel_configs:
  # "prometheus.io/scrape = true" annotation.
  - source_labels: [__meta_kubernetes_pod_annotation_prometheus_io_scrape]
    action: keep
    regex: true

  # "prometheus.io/path = <metric path>" annotation.
  - source_labels: [__meta_kubernetes_pod_annotation_prometheus_io_path]
    action: replace
    target_label: __metrics_path__
    regex: (.+)

  # "prometheus.io/port = <port>" annotation.
  - source_labels: [__address__, __meta_kubernetes_pod_annotation_prometheus_io_port]
    action: replace
    regex: ([^:]+)(?::\d+)?;(\d+)
    replacement: $1:$2
    target_label: __address__

  # "prometheus.io/scheme = https" annotation.
  - source_labels: [__meta_kubernetes_pod_annotation_prometheus_io_scheme]
    action: replace
    target_label: __scheme__
    regex: (https?)

  - action: labelmap
    regex: __meta_kubernetes_pod_label_(.+)
  - source_labels: [__meta_kubernetes_namespace]
    action: replace
    target_label: kubernetes_namespace
  - source_labels: [__meta_kubernetes_pod_name]
    action: replace
There we define that kubernetes should watch for pods annotated with the prometheus.io/scrape=true annotation. If this annotation is available Prometheus should scrape this pods for metrics.
To define on which path Prometheus should scrape, otherwise it’ll use the /metrics endpoint, we can define another annotation the prometheus.io/path=/endpoint annotation. In our example we will tell Prometheus to scape /actuator/prometheus for metrics.
The prometheus.io/port=8081 annotation is also required to tell Prometheus the port where to scrape and the last important annotation is the prometheus.io/scheme=https annotation. In our example it’s not required, but maybe you’ll run your application wtih TLS, then it’s required to tell Prometheus to scrape via HTTPS.
The other three relabel configurations are to add some labels to the scraped Prometheus metrics, to make it easier to search for some metrics.
Update the Kubernetes deployment
Now we can package our application again and dockerize it. If you used the gitlab-ci example you can simply commit your changes and push them to the master branch, now the Docker Image should be updated with the new one.
Next we’ll update the Kubernetes deployment to be compatible with the changes made to configure prometheus to scrape metrics from /actuator/prometheus:
apiVersion: extensions/v1beta1
kind: Deployment
metadata:
  generation: 1
  labels:
    app: microservice
  name: microservice
  namespace: microservice
spec:
  replicas: 1
  selector:
    matchLabels:
      app: microservice
  strategy:
    rollingUpdate:
      maxSurge: 1
      maxUnavailable: 1
    type: RollingUpdate
  template:
    metadata:
      labels:
        app: microservice
      annotations:
        prometheus.io/scrape: "true"
        prometheus.io/port: "8081"
        prometheus.io/path: "/actuator/prometheus"
    spec:
      containers:
      - name: microservice
        env:
        - name: JAVA_OPTS
          value: -Xmx256m -Xms256m
        image: registry.gitlab.com/koudingspawn-blog/simple-spring-boot:latest
        imagePullPolicy: IfNotPresent
        ports:
        - containerPort: 8080
          protocol: TCP
        resources:
          limits:
            memory: 294Mi
        livenessProbe:
          failureThreshold: 3
          httpGet:
            path: /actuator/health
            port: 8081
            scheme: HTTP
          initialDelaySeconds: 45
          periodSeconds: 10
          successThreshold: 1
          timeoutSeconds: 5
        readinessProbe:
          failureThreshold: 5
          httpGet:
            path: /actuator/health
            port: 8081
            scheme: HTTP
          initialDelaySeconds: 30
          periodSeconds: 10
          successThreshold: 1
          timeoutSeconds: 5
The important part is the spec.template.metadata.annotations-part. This annotations are copied to each pod and tells Prometheus as described above to scrape metrics on port 8081 and path /actuator/prometheus.
We also have to update the liveness and readiness probe to also use Port 8081 to check the application health. This is required because we defined the new management-port where Spring will listen on for health-check requests.
With kubectl apply -f deployment.yaml we can now bring the changes to Kubernetes.
Watch the Metrics with Grafana
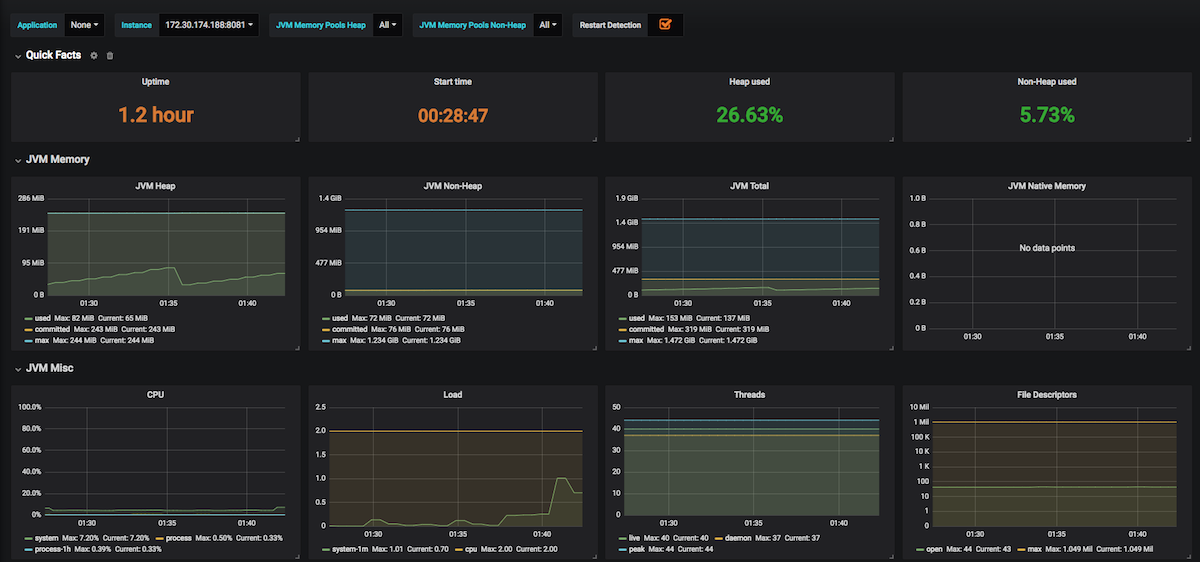
Now we can use Grafana to monitor our application. There is a Dashboard developed to show the JVM metrics Micrometer exposes, this can be simply imported in a Grafana Dashboard.
After this you should see some important metrics on Grafana. Here you can see a screenshot of the Dashboard:
In the last part of the series on how to cloudify a Spring Boot application I’ll show you how to watch logs generated by the application.