Kubernetes application logging with fluentd
Application logging in a kubernetes cluster is very easy. In this tutorial we will generate a logging concept for applications deployed on a kubernetes cluster. To save the logs and query them we use elasticsearch, for displaying them we use Kibana and for collecting the logs we use fluentd.

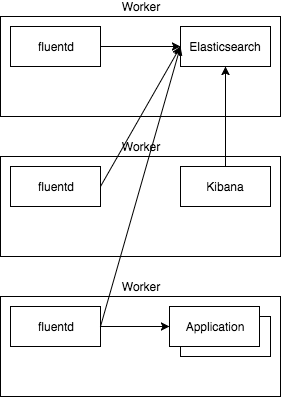
fluentd will be deployed as DaeomSet, so it runs on each node in the cluster and collects logs from the directories /var/log and /var/lib/docker/containers. Therefor hostPath volumes are used that are mounted into the fluentd container. Then fluentd will send the logs to elasticsearch where they are stored in the index logstash-* for queries. Kibana is used to display the logs and visualize them.
It is very easy to deploy it, first we need an elasticsearch server deployment and service (please pay attention this is not production grade logging):
apiVersion: v1
kind: Namespace
metadata:
  name: logging
---
apiVersion: apps/v1beta2
kind: Deployment
metadata:
  name: es
  namespace: logging
  labels:
    app: elasticsearch
spec:
  replicas: 1
  selector:
    matchLabels:
      app: elasticsearch
  template:
    metadata:
      labels:
        app: elasticsearch
    spec:
      containers:
      - name: elasticsearch
        image: docker.elastic.co/elasticsearch/elasticsearch:5.6.3
        env:
          - name: "discovery.type"
            value: "single-node"
          - name: "ES_JAVA_OPTS"
            value: "-Xms256m -Xmx256m"
          - name: "xpack.security.enabled"
            value: "false"
        resources:
          requests:
            memory: 300Mi
        ports:
        - containerPort: 9200
          name: http
          protocol: TCP
        - containerPort: 9300
          name: transport
          protocol: TCP
---
apiVersion: v1
kind: Service
metadata:
  name: elasticsearch
  namespace: logging
  labels:
    app: elasticsearch
spec:
  type: LoadBalancer
  selector:
    app: elasticsearch
  ports:
  - name: http
    port: 9200
    protocol: TCP
  - name: transport
    port: 9300
    protocol: TCP
After the elasticsearch cluster is running in the logging namespace we deploy the fluentd service as DaeomSet and connect it to the elasticsearch Database:
apiVersion: extensions/v1beta1
kind: DaemonSet
metadata:
  name: fluentd
  namespace: logging
  labels:
    k8s-app: fluentd-logging
    version: v1
    kubernetes.io/cluster-service: "true"
spec:
  template:
    metadata:
      labels:
        k8s-app: fluentd-logging
        version: v1
        kubernetes.io/cluster-service: "true"
    spec:
      tolerations:
      - key: node-role.kubernetes.io/master
        effect: NoSchedule
      containers:
      - name: fluentd
        image: fluent/fluentd-kubernetes-daemonset:elasticsearch
        env:
          - name:  FLUENT_ELASTICSEARCH_HOST
            value: "elasticsearch"
          - name:  FLUENT_ELASTICSEARCH_PORT
            value: "9200"
          - name: FLUENT_ELASTICSEARCH_SCHEME
            value: "http"
        resources:
          limits:
            memory: 200Mi
          requests:
            cpu: 100m
            memory: 200Mi
        volumeMounts:
        - name: varlog
          mountPath: /var/log
        - name: varlibdockercontainers
          mountPath: /var/lib/docker/containers
          readOnly: true
      terminationGracePeriodSeconds: 30
      volumes:
      - name: varlog
        hostPath:
          path: /var/log
      - name: varlibdockercontainers
        hostPath:
          path: /var/lib/docker/containers
After this fluentd will watch for new logs and send them to the elasticsearch service.
As last component we need the kibana dashboard to visualize the logs:
apiVersion: apps/v1beta2
kind: Deployment
metadata:
  name: kibana-logging
  namespace: logging
  labels:
    app: kibana-logging
    kubernetes.io/cluster-service: "true"
    addonmanager.kubernetes.io/mode: Reconcile
spec:
  replicas: 1
  selector:
    matchLabels:
      app: kibana-logging
  template:
    metadata:
      labels:
        app: kibana-logging
    spec:
      containers:
      - name: kibana-logging
        image: docker.elastic.co/kibana/kibana:5.6.2
        resources:
          limits:
            cpu: 1000m
          requests:
            cpu: 100m
        env:
          - name: ELASTICSEARCH_URL
            value: http://elasticsearch:9200
          - name: XPACK_MONITORING_ENABLED
            value: "false"
          - name: XPACK_SECURITY_ENABLED
            value: "false"
        ports:
        - containerPort: 5601
          name: ui
          protocol: TCP
---
apiVersion: v1
kind: Service
metadata:
  name: kibana
  namespace: logging
  labels:
    app: kibana-logging
spec:
  type: LoadBalancer
  selector:
    app: kibana-logging
  ports:
  - name: http
    port: 5601
    protocol: TCP
---
apiVersion: extensions/v1beta1
kind: Ingress
metadata:
  name: ingress
  namespace: logging
  annotations:
    kubernetes.io/ingress.class: "nginx"
spec:
  rules:
  - host: logging.url.de
    http:
      paths:
      - path: /
        backend:
          serviceName: kibana
          servicePort: 5601
Now there should be a complete logging environment available that can be accessed, in my case via the ingress url.
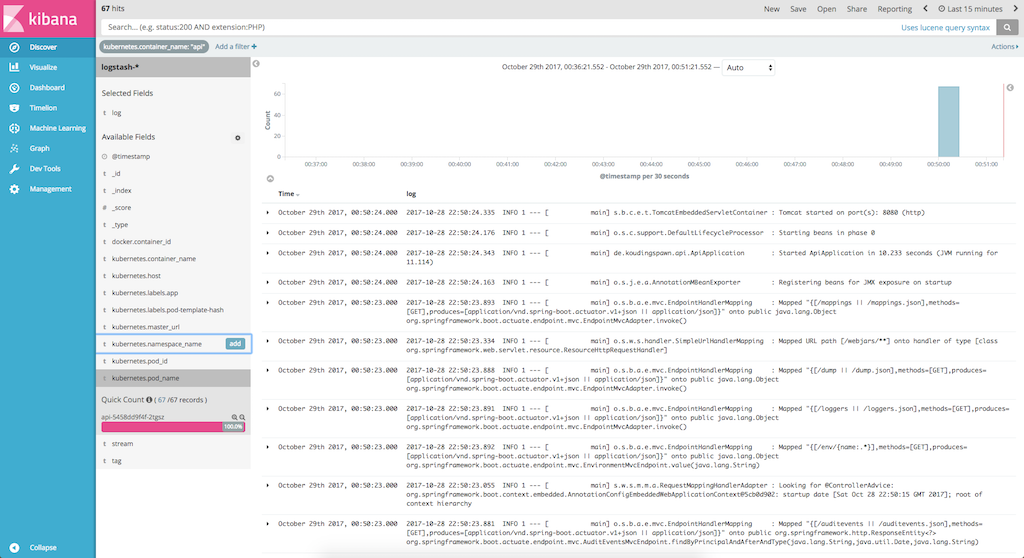
After this we only need to add the logstash-* index to Kibana, now we should visualize the logs:

One very interesting part is the available fields list, this allows us to query for specific containers or for example for requests made via nginx-ingress.
One problem of this solution is, that the elasticsearch containers are not persisted, if the container fails all data are lost. One solution might be to add persistentVolume to a container like glusterFS. At the same time, it is important to note that if the cluster fails, the logs may not be accessible.

